Open Access Data
Agricultural land use impacts aquatic greenhouse gas emissions from wetlands in the Canadian Prairie Pothole Region
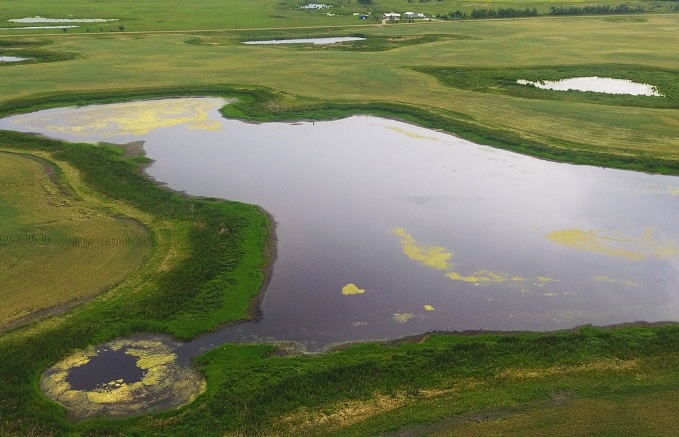
This dataset presents a survey of greenhouse gas content, emissions rates, and biogeochemical features of open water wetland habitats in the three prairie provinces of the Canadian Prairies. A subset of the data have been previously published by Soued et al. 2024. Nature Communications, but this dataset is revised to correct for a minor error.
Seasonal concentrations and fluxes of dissolved, soluble, and colloidal Fe and dissolved organic matter amount and composition (DOC and PARAFAC)
This dataset includes:
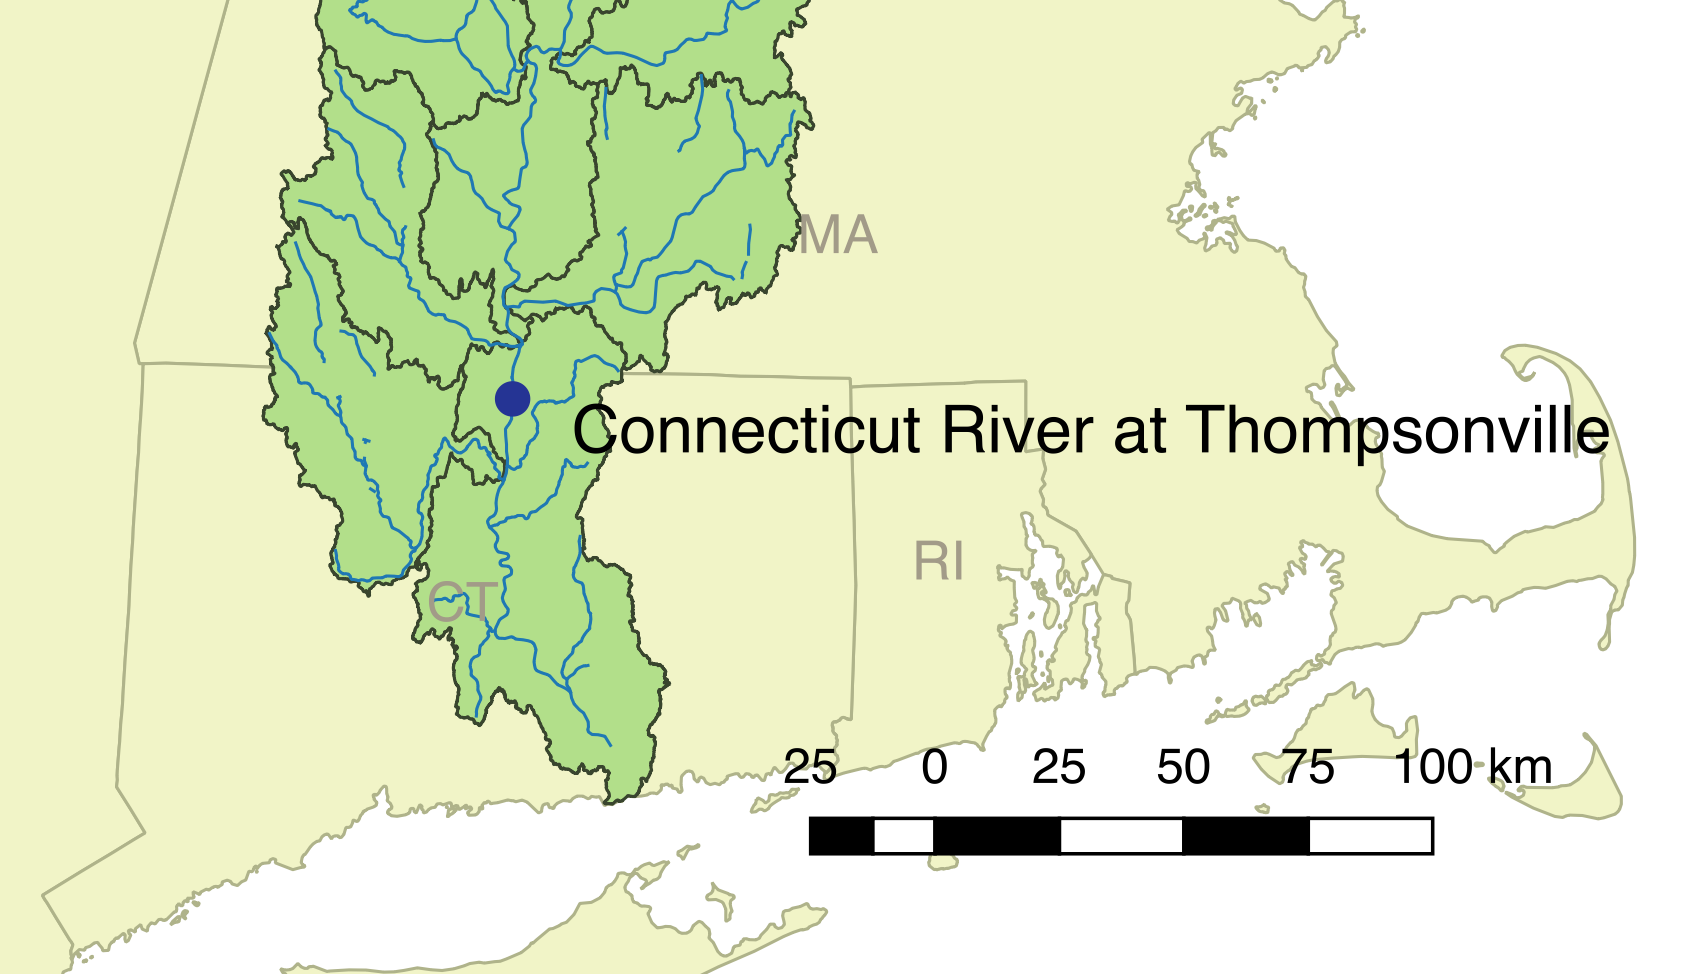
1- Operationally dissolved (<0.22 µm), colloidal (0.02-0.22 µm), and soluble (<0.02 µm) DOC concentrations, total Fe concentrations, PARAFAC component scores <0.22 µm, and end-member mixing model scores <0.22 µm. Samples were collected approximately bi-weekly from the Connecticut River at Thompsonville from April 2018 to March 2020.
2- LOADEST-modeled daily-average and monthly-average fluxes of operationally dissolved (<0.22 µm), colloidal (0.02-0.22 µm), and soluble (<0.02 µm) Fe, DOC <0.22 µm, and allochthonous-like DOC <0.22 µm.
Riverine truly dissolved, colloidal, and operationally dissolved Fe(III), DOC, a254, a412, and SUVA254
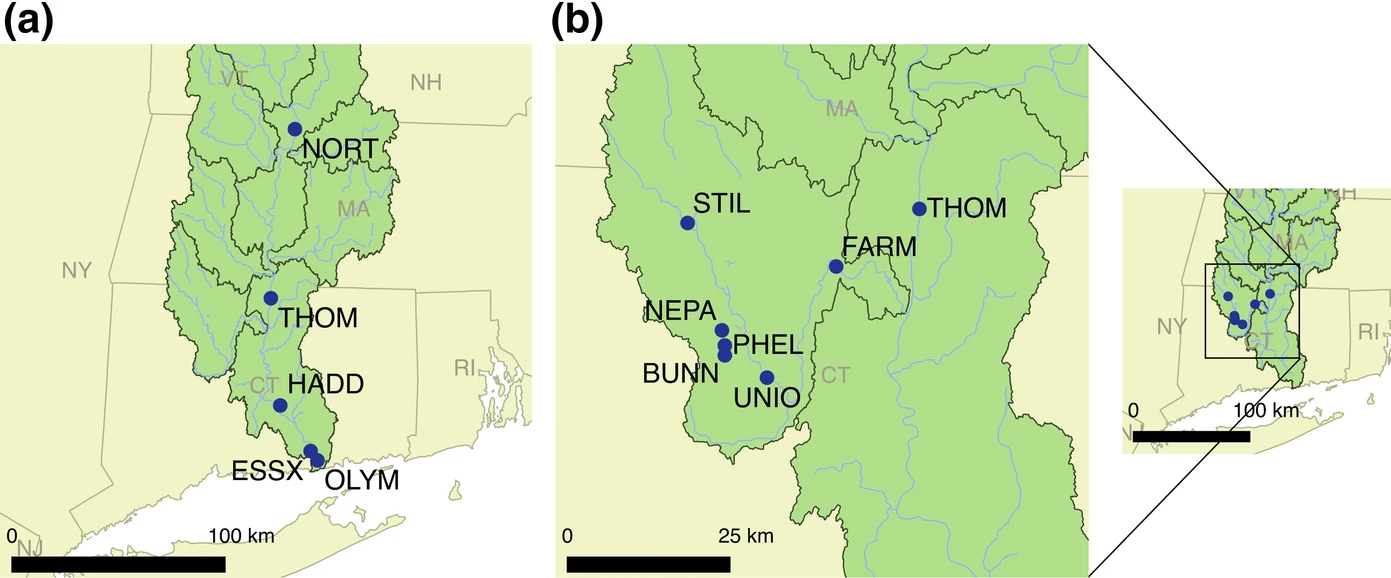
This dataset includes concentrations of Fe(III) and DOC along with UV-Vis absorption coefficients at 254 nm and 412 nm on the operationally dissolved size fraction (<0.22 μm), as well as the truly dissolved (<0.02 μm) and colloidal (0.02-0.22 μm) size fractions. Samples were collected every 2 weeks at 5 sites along the Connecticut River mainstem from 2018 to 2020 and at 7 sites in the Connecticut River watershed sampled once synoptically during the summer 2019.
Chesapeake Bay marsh-exported CDOM photo- and bio-degradation incubations
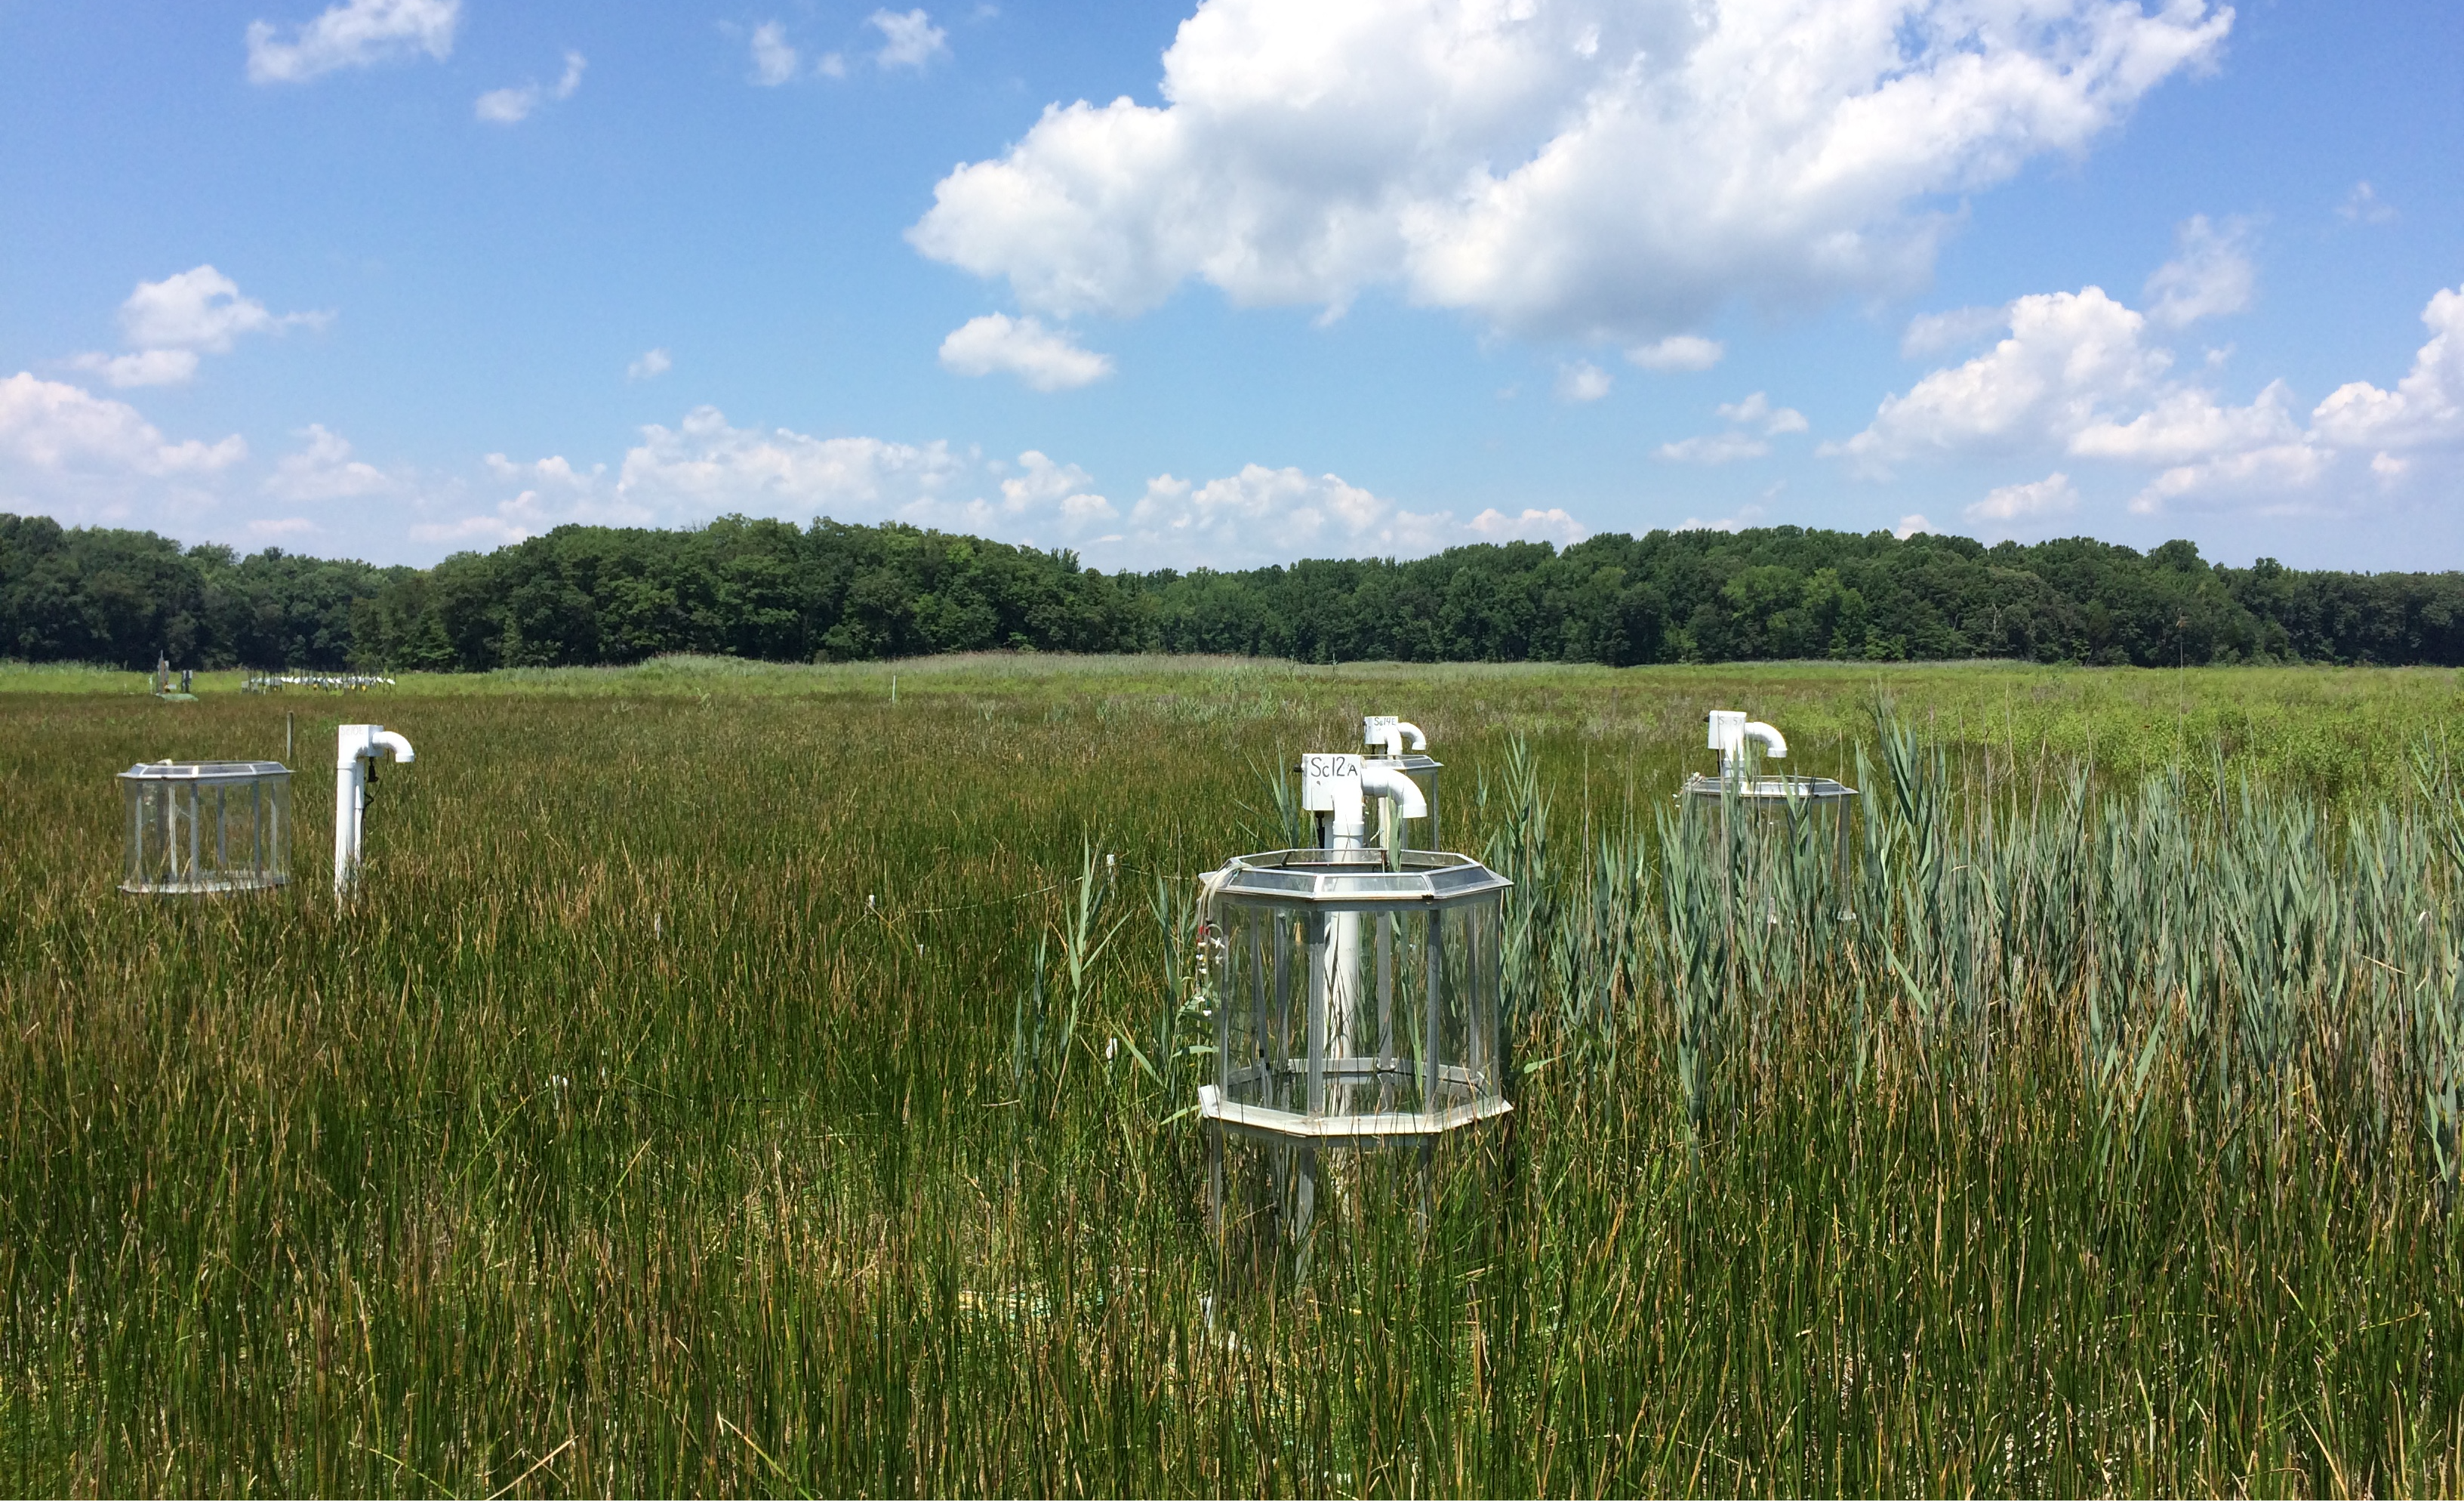
This dataset includes seasonal measurements of photochemical and microbial degradation incubation experiments conducted on CDOM collected draining four Chesapeake Bay marshes from 2016 to 2017. Dataset includes incubation starting and ending DOC concentrations, PARAFAC components, a300, SR, S275-295, and S350-400. Dataset also includes microbial counts for 0.2 µm and GF/F (0.7 µm nominal pore size) for a light and dark incubation.
Custom R Functions and R Tutorials
Function: Color Palette

Workshop: Publication-ready figures in R ggplot2
